Portfolio Statement
Your securities and their value are displayed in the portfolio statement.
Selecting the securities account
There is a drop-down menu containing all available securities accounts directly below the heading “Securities Account Overview”, Select the securities account you require with a mouse click to load the appropriate securities account overview.
The range of securities accounts overviews
Your securities account has four different views:
- Securities account according to instruments
- Securities account according to structures
- Securities account - a comparison of structures
- Securities account analysis (performance and performance contributions)
By clicking on the required view you can directly call up the relevant view. The securities account overview according to instruments is preset.
1. Securities account according to instruments
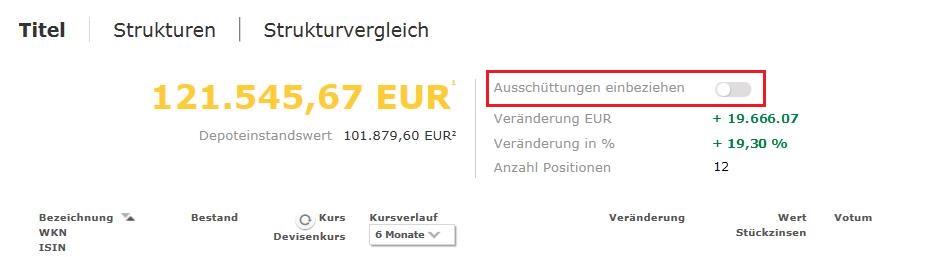
The "Securities account overview according to instruments" will inform you about prices (yellow font) in the upper area and important key performance indicators (cost price, change, number of positions) of the overall securities account.
In the lower area you will find an alphabetic list of all the securities in the securities account. Each line contains one security position with the most important information (portfolio, maturity date, current price, performance, change, value, accrued interest, recommendation) and buttons to buy/sell the item.
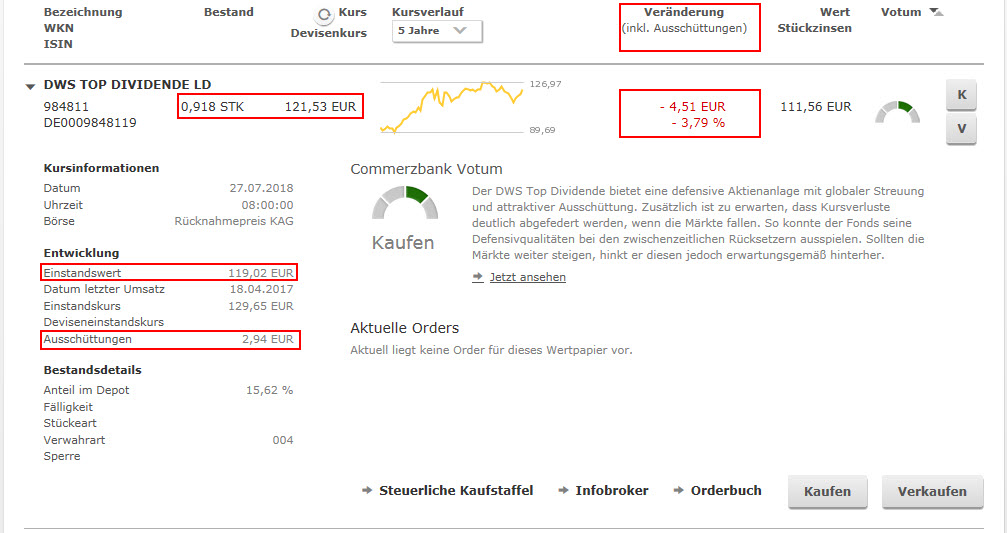
Additional detailed information can be shown or hidden by clicking on the relevant line. You will find additional information about the price, development, portfolio details, the Commerzbank recommendation and notes about any current orders here. As further interaction possibilities, the links to the tax purchase scale, the info broker, the order book and the purchase or sales mask are available to you here.
In the securities account overviews by security and by structure, it is up to you to decide whether the payouts received to date should be included in the calculation of the change in the securities account.
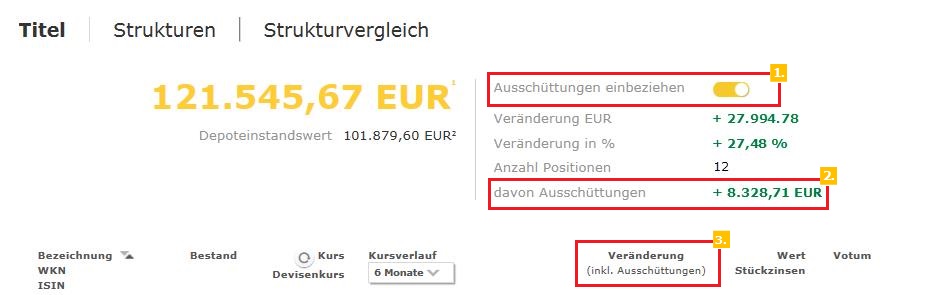
If the inclusion of payouts has been activated (1), the amount of how many payouts (2) are contained in the changes is shown below the change information.
In addition, the column "Change" in the table shows the note "(payouts included)" (3).
The Changes in EUR and Percentage item is a comparison between the cost price value and the value in EUR as of the reporting date plus the gross payouts and changes in accrued interest to date.
You can view all the relevant data for calculating the change in EUR and percent at the level of the individual value by clicking on the security.
2. Securities account according to structures
On the page “Securities account overview according to structures”, at the first level you will get an overview of the composition of your total securities account sorted according to the various asset classes. It is presented both as a pie chart and as a table giving the respective amount or the percentage.
In the lower area you have the possibility to display the specific securities of the individual asset classes. With a simple mouse click you can select the required asset class / subasset class.
Additional detailed information about the individual securities can be shown or hidden by clicking on the relevant line. You will find additional information about the share of the securities account, the current price, development, portfolio details and the Commerzbank recommendation here.
In the securities account overviews by security and by structure, it is up to you to decide whether the payouts received to date should be included in the calculation of the change in the securities account. You will find the switch for activating and deactivating distributions in the calculation on the securities account overview by security.
Where the inclusion of payouts has been activated, you can read the values from the securities account table on the securities account overview by structure. The table shows the change in EUR (1) and the change in % (2).
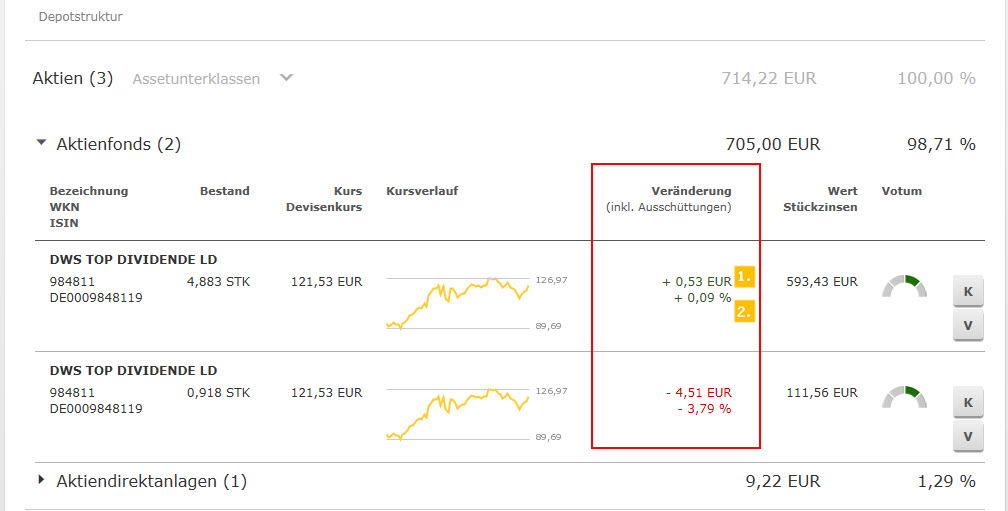
The inclusion of distributions is also taken into account within the product view of the securities account overview by structures. You can open the product view by clicking on the required security. Here you can show or hide the corresponding details for the security.

3. Securities account - a comparison of structures
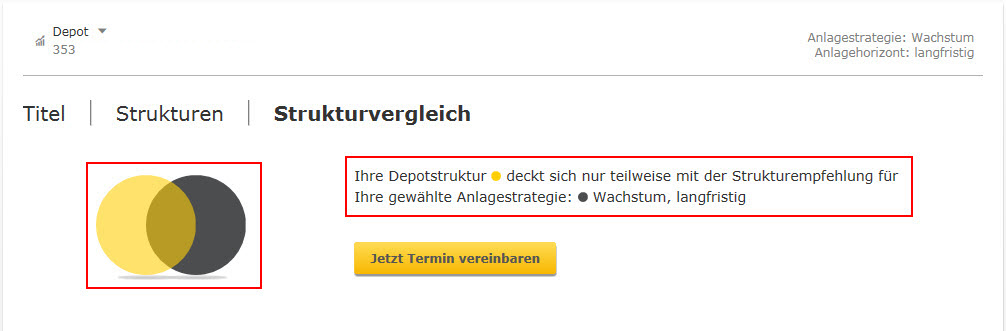
On the page “Structural comparison” there is a comparison between your current securities account structure and the Commerzbank structure recommendation on the basis of the investment strategy you have selected.
As a result, you will see your structure (yellow circle) in the matching graphic compared to the structure we recommend (grey circle). The more the two circles overlap, the more your securities account structure corresponds with the Commerzbank structural recommendation. In addition, you will receive the resulting assessment of any need for action.
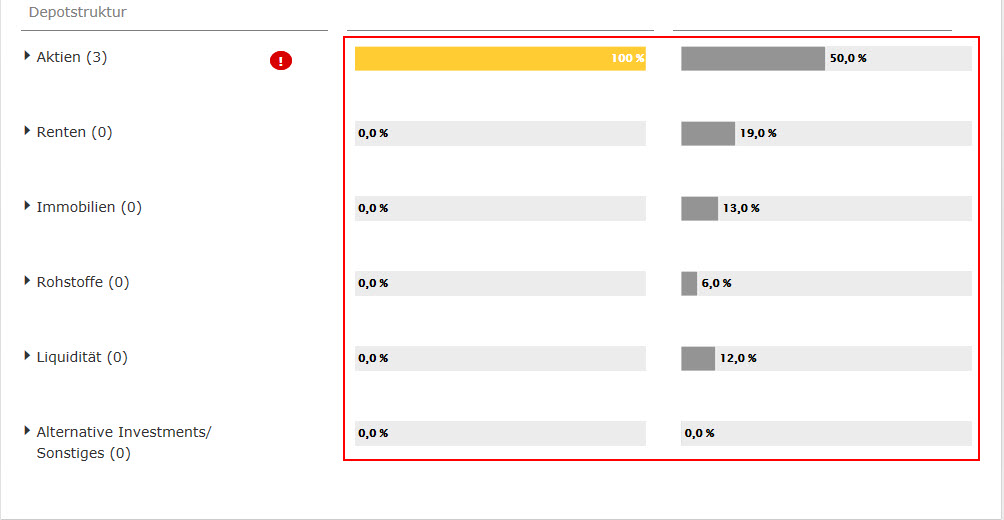
In the lower area you will receive a comparison of which percentage of your securities account is invested in the asset classes and how the asset classes should be invested according to the structural recommendation.
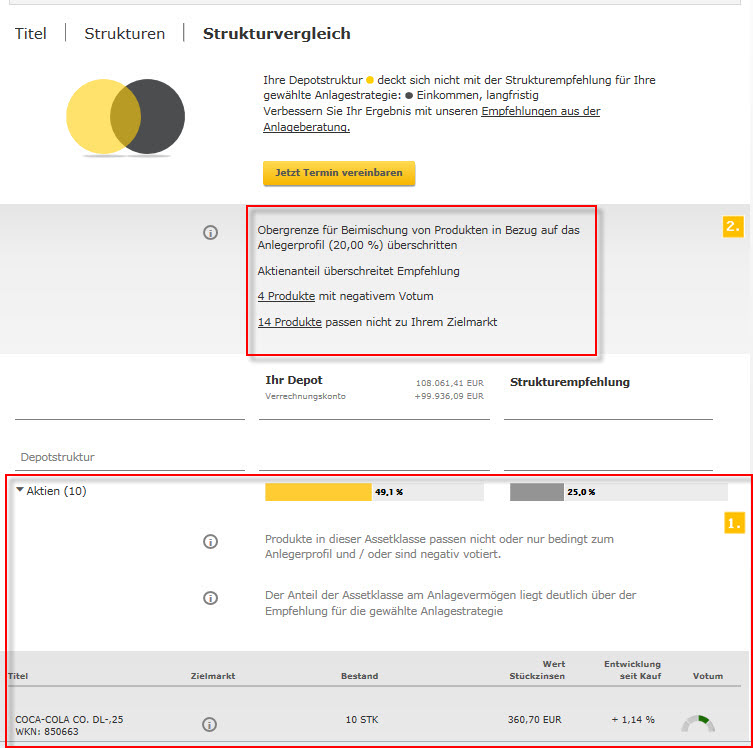
In the structural comparison, the individual securities can be displayed as in the securities account view by structures. This means that the asset classes can be opened (1). In addition, you will be shown instructions on how to proceed for your categories. These include information on negative votes as well as deviations from the investor profile and soon maturing securities (2). If an asset class is too highly weighted, a corresponding note is also given.
Contact your advisor for more information on these notes.
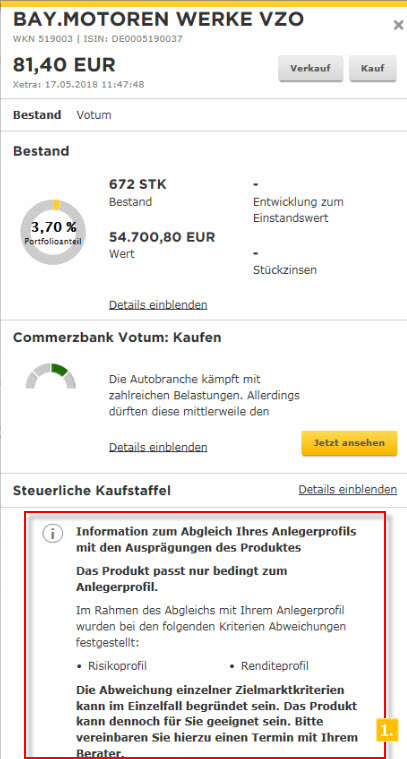
By clicking on the title it is also possible to open the product views of the individual titles from the structure comparison. This product view was supplemented by further data for comparison with your investor profile (1). The deviation of individual target market criteria may be justified in individual cases. The product may nevertheless be appropriate for you. Please make an appointment with your consultant if necessary.
4. Securities account overview - analysis
Performance
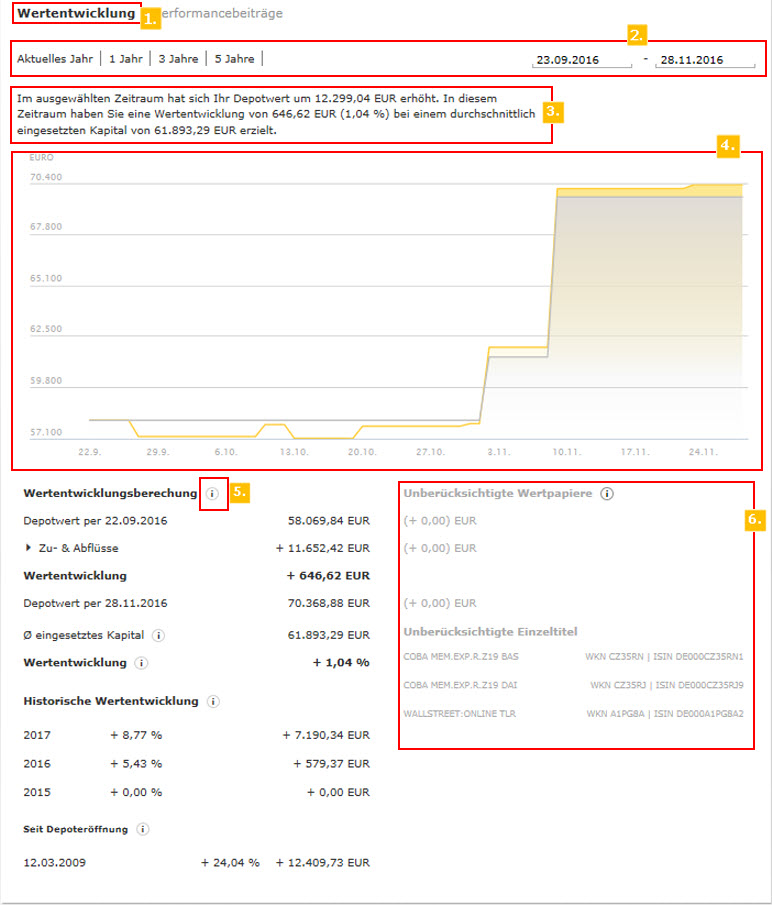
The "Securities account overview performance" informs you about the performance of your total securities account in the selected period under review. You can call this up via your securities account overview - Analysis - Performance (1). Directly below, you can select the period for which you want to display the performance (2). The preset year is always the current calendar year.
In contrast to the securities account view by securities, which only shows the change in value between the current date and the acquisition value of all securities still held in the securities account, this is the capital-weighted performance of the securities account.
The performance report is introduced with a summary explanatory sentence that gives you an overview of the most important key information (3). The next step is a graphical overview of the change in the securities account value, taking into account inflows and outflows. These two pieces of information allow you to see how your securities account value has been affected by market changes as well as inflows and outflows.
This allows you to get an accurate picture at a glance of the changes in your securities account value over time, and to distinguish real performance from cash flows.
The grey line represents your portfolio start value at the beginning of the period under review and changes with inflows and outflows. The yellow line, on the other hand, indicates the change in the securities account value due to gains or losses (price changes and income). If the yellow line is below the grey line, then negative market changes have pushed your securities account value below the cost value. If the yellow line is above the grey line, your securities have increased their value through positive market changes and returns.
The lower third of the securities account view shows the performance of your securities account in tabular form. You also get an overview of inflows and outflows as well as historical performance. You will receive further explanations via integrated tooltips (5).
If items exist in the reporting period that cannot be taken into account due to missing valuations, these items are also listed (6).
You will find detailed explanations of the individual terms used in the securities account analysis in the Terms Explanations section.
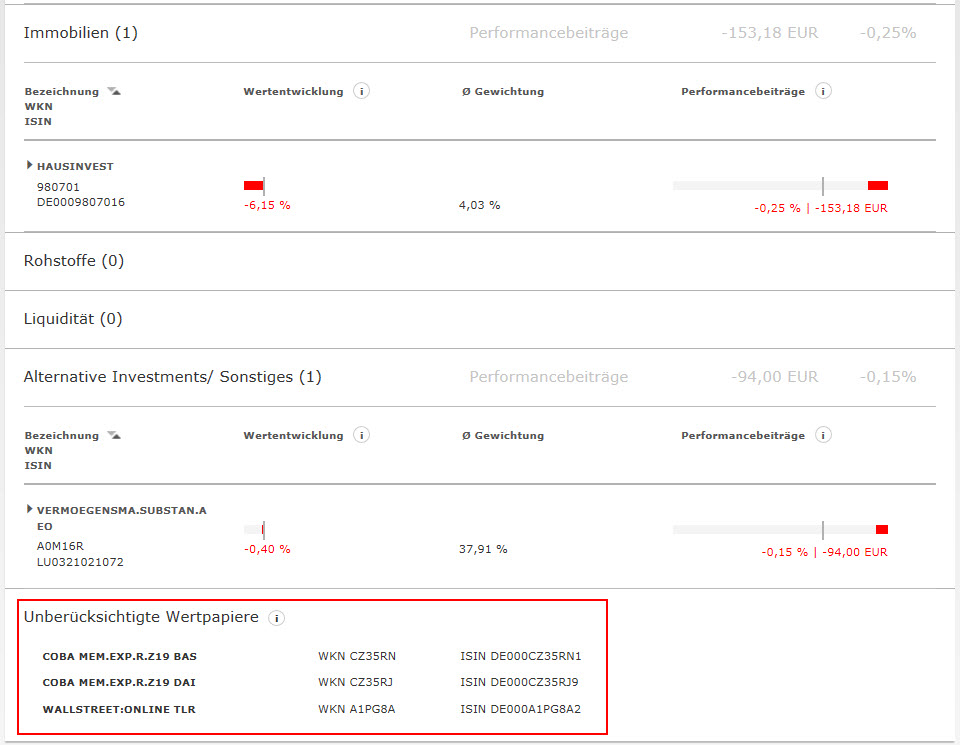
Excursus " Disregarded stocks ": A security cannot be taken into account for performance or performance contributions if it did not have a valuation at the beginning, end or turnover within the period under review. This may be due to the fact that no price is/was available for the security.
These securities are then deducted from the value of the securities account, the average capital employed and the inflows and outflows. The amount of these securities and where they were deducted is shown in both chart (4) and table (6) (see previous figure).
Special case: If the price of a security was only temporarily unavailable, but at the beginning and end, this is only visible in the performance chart (4) (downward deflection). This does not affect the performance calculation itself.
Performance contributions
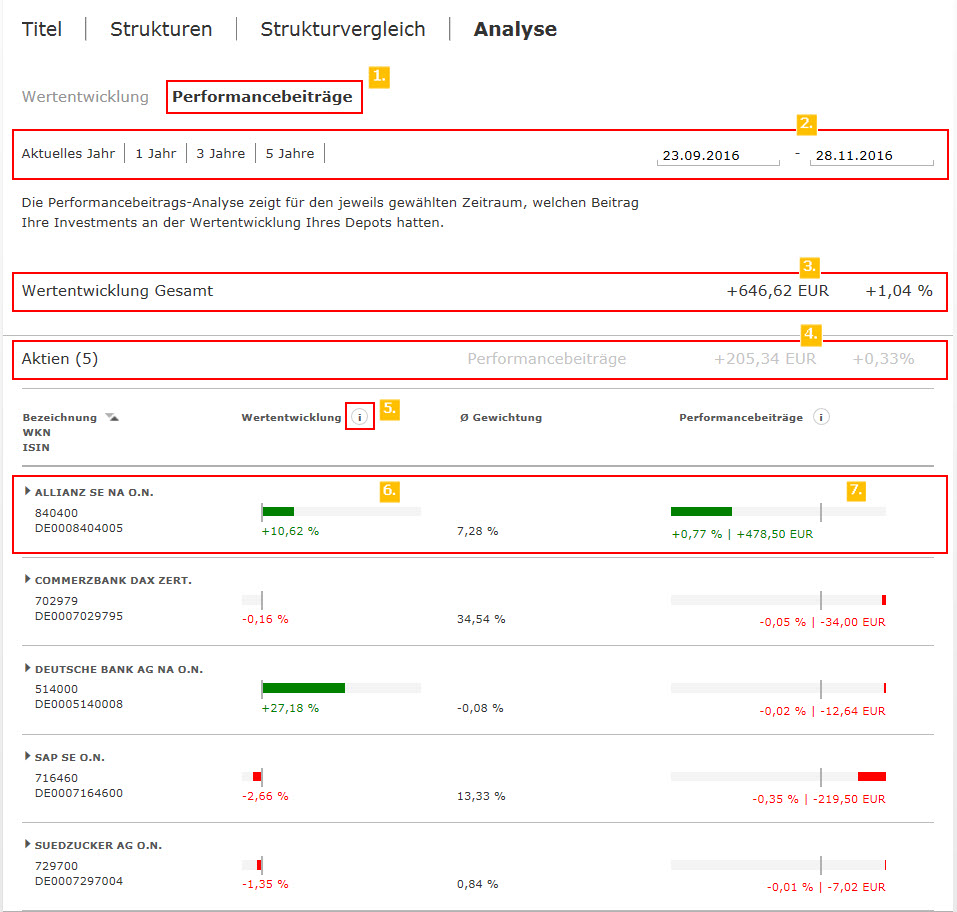
The „Securities account overview performance contributions " informs you, for the selected period, what contribution your individual investments made to the performance/value development of your securities account. You can call this up via your securities account overview - Analysis - Performance contributions (1). Directly below, you can select the period for which you want to have the performance contributions displayed (2). You will also receive more detailed information about your securities.
It should also be noted here that the performance contribution analysis is based on a capital-weighted performance. You will find the mere change in value, i.e. the difference between the cost value and the current value (including payouts if applicable) in the securities account view by security.
For better clarity, graphic elements have been added to facilitate orientation and the finding of relevant items.
The first relevant information is the display of the overall performance for the selected period (3).
The performance contributions break down this overall performance. They are visible both at asset class level (4) and at individual security level. This enables you to take a view related to the securities account on the distribution of your performance.
You will receive further explanations via integrated tooltips (5).
At the single security level, 2 charts are displayed:
The first chart (6) shows you the capital-weighted performance of the security in the period under review. The green bar corresponds to the performance of the security in question, the grey bar below shows the performance of the security with the highest performance. This gives you a quick overview of how the performance of the individual securities was when compared with one another. If the bar is red, the performance of the security was negative. The grey bar then corresponds to the performance of the security with the worst performance.
The second chart (7) shows the performance contributions as a diagram. A green bar represents a positive contribution and a red bar a negative contribution to the overall performance of the portfolio. The grey part of the bar is the sum of all positive performance contributions or the sum of all negative performance contributions. This allows you to get a quick overview of what the performance contribution of the individual securities is compared to the overall positive or negative performance of the portfolio.
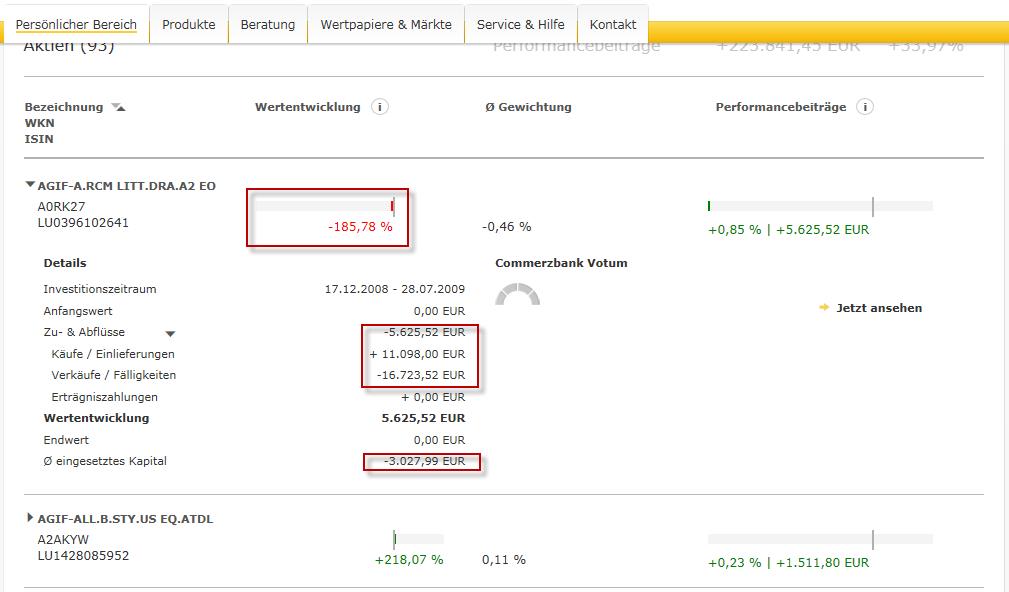
Negative average capital employed
If sales or maturities of a security are realized that exceed the original invested capital, a negative average invested capital may be reported (depending on the period under review).
In this case, a negative percentage performance is shown for the value on the basis of the calculation principles of the capital-weighted performance.
This is a purely mathematical effect. However, the absolute performance in EUR is correct.
If you wish to compare the performance of a particular security with the other values in the securities account, it is advisable to set the period under review for the entire securities account to the investment time of the value.
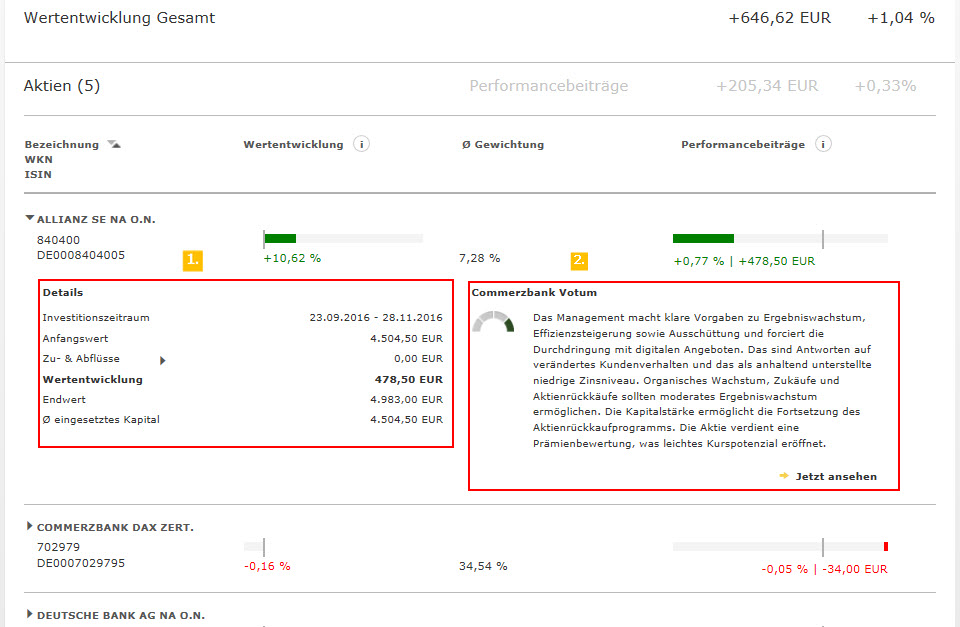
The individual securities can be opened to display the calculation details (1). This allows you to easily understand the composition of the performance of an individual security and its contribution to performance.
Caution: No conclusions can be drawn about the quality of the investment on the basis of the performance of an individual security compared with other securities in the portfolio or its performance contribution to the overall performance of the portfolio.
This always requires a qualitative consideration of the individual type. For this reason, you will find the vote (2) of our capital market experts on the security directly next to the details for more detailed information. If you have any doubts or questions, please fix an appointment with your consultant.
If items exist in the reporting period that cannot be taken into account due to missing valuations, these items are listed at the end of the page.
You will find detailed explanations of the individual terms used in the securities account analysis in the Terms Explanations section.
Example:
On the basis of the previous three example pictures, we want to give you a reading example for a better understanding.
In the period from 23 Sept. 2016 to 28 Nov. 2016, the securities account achieved a performance of +1.04% or +646.62 euros. Of this, +0.33% (+€205.34) is attributable to the shares asset class (the remaining +0.71% and +€441.28, respectively, are distributed among the other asset classes not shown in the pictures). Of the performance of the total portfolio of +1.04% (or the contribution of the share asset class of +0.33%), a contribution of +0.77% (+€487.50) is attributable to the Allianz share. On the other hand, the SAP share, for example, made a negative performance contribution of -0.35% (-219.50€). The performance is thus the sum of all positive and negative performance contributions of the individual items in the securities account (or asset classes).
The Allianz share achieved an overall performance of +10.62% in the period under review. An average of € 4,504.50 was invested in this share during this period. The share thus had a weighting of 7.28% in relation to the average capital invested in the portfolio. As 7.28% of the portfolio was invested in Allianz, the +10.62% performance of the share made a performance contribution of +0.77% to the securities account.
Benefits of performance contribution analysis:
The performance contribution analysis should give you a deeper insight into the sources of the results of your securities account, because ultimately the performance of your securities account is only the sum of the results of the individual securities and their weighting. No direct conclusions on investment decisions can or should be derived from this analysis. This analysis is only intended to help you find the items in the securities account where it makes sense to take a closer look at the quality of the security, its share in the result of the account and within the structure of the account.
In this example, it might be interesting to take a closer look at the SAP share because it has the largest negative performance contribution on the share side, although the share did not have such a pronounced negative performance. An indicator showing that the weighting of the share in the portfolio may be too high. If, at the same time, the share still has a negative vote and the securities account structure of the shares asset class can be optimised (sectors, countries, instruments), this share could represent a suitable source of funds.
The Dax certificate would also be worth looking at. It accounts for 1/3 of the entire securities account without any significant performance contribution. Here, too, the vote, the structure of the securities account and the structure of the shares asset class (in this case, for example, a look at the country distribution) should be examined to see whether there is scope for optimisation.
Please note that under no circumstances can or should investment decisions be made solely on the basis of performance or performance contributions. Moreover, past results are not an indicator of future developments. Therefore, a qualitative examination of your investments and the structure of the securities account and the asset classes are always necessary. Do you have a securities account model with advisory services? In this case, your consultant will be pleased to give you individual advice.
The functions in the securities account overviews
The securities account position tables have a sort function. If you move the mouse pointer over the headings in the table header, these will be activated and you can sort your securities account positions in ascending or descending order. The sorting currently activated is shown by an arrow behind the table heading.
On the far right of the line of a securities account item you will find the buttons “B” and “S” with which you can buy or sell portfolios. The buttons are repeated at the lower end of the drop-down level. If the buttons are inactive, you as a client do not have the necessary authorisation to trade this security. In this case, please contact your advisor in the branch.
By simply clicking on the “Update” button in the table header you can call up the real time price of the security at any time. Furthermore, using the menu in the table header you can change the time period shown for all securities from 5 days to 5 years.
If you have dropped the security down with a click, you will find a link to the tax purchase scale, the info broker and the order book at the lower end of the drop-down area. You can view more detailed information about your security via the links. This function is only available in online banking for the time being.
If Commerzbank has made a recommendation for your security, this will be shown in the “Recommendation” column. If the security has been dropped down, you can read the text justifying the recommendation.
If there are current orders for security portfolios, these will be shown in the dropped down area. You can directly view up to two current orders here. For further information, please follow the link to the order book. If you wish to update the current orders for an affected securities account position, please click on the button to the right next to the heading “Current Orders”.
The individual asset classes can be dropped down in the securities account overview by structures, thus showing the individual instruments.
The valuation of your securities portfolios
The securities in your securities account are generally valued at current prices. This means that when opening the securities account overview the current price of each security is usually not more than a few minutes old. If there is no up-to-date daily price available, the last known price is used for the valuation in exceptional cases. You can view the up-to-date status of the price in the drop-down level below price information.
To update the valuation prices for your securities, click on the button next to the table heading “Price”. This procedure will call up the last available near-time stock exchange price for your security and is drawn on for the valuation.
Please note that the securities account valuation in the financial overview (start page online) relates to the previous day. This is the reason why there can be differences between the total balances in the securities account overview and the financial overview.
Product view
The product view will allow you to get an overview of the most important information about a security you have selected. The product view contains information about the securities account portfolio, the securities account share in per cent, the development in the cost price, the Commerzbank recommendation (not available for every security) and the tax purchase scale.
Definition of terms
- Recommendation: Commerzbank publishes general assessments or valuations for selected securities on the development prospects of a security, so-called recommendations.
A recommendation is not an individual investment recommendation and does not take personal investment targets into account. Therefore, this is not a recommendation to buy or sell securities. Your advisor will inform you to what extent there is a need for action in your personal situation in individual investment advice. - Asset classes: Commerzbank divides securities into six different types of assets, so-called asset classes. A differentiation is made between equities, bonds, property, commodities, liquidity (including securities clearing account) and alternative investments/miscellaneous.
- Investment strategy: There are four investment strategies at Commerzbank (Stability, Income, Growth and Chance), which differ in their emphasis on opportunities and risks. The client sets the investment strategy, which has to be updated at regular intervals.
- Structural recommendation: The structural recommendation shows the current allocation (breakdown) to various asset class levels that Commerzbank recommends with a view to the upcoming 3 to 6 months. The allocation provides the Commerzbank recommendation for securities account structuring for the four investment strategies.
- Managed products: From our point of view managed products include securities actively managed by fund management and that are continuously adjusted to market circumstances. In this connection, the fund management not only chooses the instruments in the product, it also distributes the assets independently across the various asset classes. By clicking on an asset class the amount is shown that comes from managed products of the relevant asset class.
- Need for action: The need for action shows how much your securities account deviates from the Commerzbank structural recommendation. If there is no or only little matching, there is a high need for action.
- Alternative Investments / Miscellaneous: This asset class includes securities that cannot clearly be allocated to any other asset class. One example of these is private equity investments.
- Upper limit: The upper limit shows the maximum share per asset class that in Commerzbank’s view should not be exceeded for the selected investment strategy. In this connection, the asset in this asset class is put into proportion with the total of the securities account and the liquidity of the clearing account.
- Clearing account: The reference account, through which the securities transactions of the securities account are settled, is described as a clearing account. The credits on this account are taken into account when considering the investment strategy and distributing assets to the various asset classes. This is shown in the asset class “Liquidity” on the page “Securities account overview according to structure”. We recommend you only deposit funds in this account that are planned for securities investments or are attributable to the assets of the securities account. Therefore, use a separate account as a clearing account for the respective securities account as far as possible. It is possible to switch off the consideration of the clearing account manually.
- Cost price: The cost price is the purchase price including purchase expenses and the accrued interest. Only portfolios in the securities account on the valuation date are taken into account. Already sold positions are not included in the calculation (FiFo method). The presentation is generally in the currency in which the first portfolio of this position was acquired. In the event of a subscription right separation a subscription discount is made. (You will find the tax acquisition costs including indirect costs via the purchase scale button.)
- Last transaction: Is the day on which the last change of the stock took place through a purchase.
- Foreign exchange cost price: The average foreign exchange cost price is shown here, which is calculated as follows: Total of all purchase price values in the traded currency/total of all price values in euros.
- Cost price value: This shows all settlement amounts from purchases of the current portfolio (converted into EUR).
Formula: Portfolio * costs price/foreign exchange cost price - Payouts: The field “Payouts” shows the payouts and interest since 1 January 2005 (for former Dresdner Bank securities accounts since 1 January 2001) as gross amounts (i.e. incl. taxes = before taxes are deducted).
However, this exclusively applies to the portfolio booked in the securities account at the time under review. Sales made in the meantime are not taken into account for calculating the “payout”. It should be noted in this connection that sales are settled according to the FiFo method (First-in-First-out). This means the only payouts shown are those relating to items still in the portfolio at the time of the review. - Change in EUR: This is a comparison between the cost price value and the value in EUR on the report date plus the gross payouts and accrued interest changes up to that point in time.
- Change in %: The EUR change in the securities account position on the report date in % is shown here.
Formula: 100 / cost price in EUR * change EUR - Value: The total value of the position on the report date in euros excluding accrued interest is shown here.
Formula: Portfolio * Shares Price / Exchange rate - Accrued interest: The accrued interest column shows the accrued interest from the last coupon date (interest payment) before the report date until the report date.
- Performance calculation: The performance over the selected period corresponds to the securities account value excluding inflows and outflows, such as purchases/deposits, sales/maturities and earnings payments.
Calculation of absolute performance =
Value of securities account
- initial value of securities account
+ securities sales / surrenders / maturities
+ earnings payments
- purchases / deposits
This prevents capital flows from distorting performance in a positive or negative way. - Historical performance: The historical performance allows a review of the performance of recent years. It is expressed in euros and as a percentage of the average capital employed in the calendar year under review.
- Performance: The performance provides an indication of how the value of your portfolio has changed over the selected period. This must be distinguished from the securities account volume, which includes the components inflows and outflows, such as purchases/deposits, sales/maturities and earnings payments.
- Average capital employed: The average capital employed is calculated by weighting the individual purchases / sales of securities and other transactions according to their availability in the securities account over time. The use of this value as a basis enables an exact calculation of the performance on the actually committed capital in the period under consideration.
- Unconsidered securities: Some securities cannot be included in the calculations because they were temporarily or permanently unvalued within the period under review (no price available). These nonvaluated stocks are listed separately. They are not included in the performance calculation, but are completely neutralized in the calculation in order to prevent falsification of the results. The resulting adjustment items for the securities account positions at the beginning and end of the reporting period as well as the security purchases/deposits are displayed with a positive sign. The adjustment items for the security sales/deposits/maturity dates and the revenue payments are displayed with a negative sign.
- Since the opening of the securities account: This position includes the historical performance since the date of the first transaction, at the earliest since 01 Jan 2004.
- Performance contributions: This position includes the share of the security in the total performance of the securities account, taking into account the volume, measured against the total volume of the securities account:
- Securities purchases / Deposits: This position contains all values that flowed into the securities account in the reporting period as a result of purchases or deposits.
- Securities sales / Surrenders / Maturities: This item contains all values that left the securities account in the reporting period due to sales, surrenders, and due dates.
- Earnings payments: This item contains earnings payments (dividends, interest, bonus payments, fund distributions) that were paid from existing positions during the reporting period.
- Investment period: The investment period is the period of the reporting period in which the item was in the securities account.
- Initial value: The position / asset class / securities account was valued at this value at the beginning of the report.
- End value: The position / asset class / securities account was valued at this value at the end of the report.
- Inflows and outflows: Inflows include all (inflows) purchases / entries of the position / asset class / securities account within the investment period. Outflows show all sales / disposals / maturities of the item within the investment period.